
Finance teams track error rates: invoices with an error, journal entries corrected, reports reissued. A single number each month hides whether the process is stable, whether a change helped, or whether a spike deserves investigation. A p-chart shows all three.
This guide explains the p-chart and how to read it, how to convert an error rate to a sigma level, and works through 12 weeks of invoice error data in which one week falls outside the limits because of a specific, findable cause.
Before You Start
Why Chart the Error Rate
Numbers Vary by Chance
An error rate of 6.5% one week and 5.8% the next may be noise. A control chart separates normal variation from a real change.
Reacting to Noise Wastes Effort
Chasing every up-tick sends teams looking for causes that do not exist.
Real Signals Deserve Attention
A point outside the limits usually has a specific cause, such as a system change or a new supplier, that can be found.
It Shows Whether Improvements Stick
After a fix, the center line should shift and stay there.

The p-Chart
A p-chart tracks the proportion of nonconforming units, such as invoices with an error, over time. From the average proportion p̄ and the sample size n:
Limits get wider if the sample size n varies from period to period, so calculate them for each point. Signals include a point beyond a limit, a run of eight or so points on one side of the center line, or a steady trend. See the SPC Control Charts Guide and Attribute Control Charts.
From Error Rate to Sigma Level
A defect rate can be expressed as a sigma level, a common way to compare processes. It converts the yield (1 − error rate) to a z-score with the normal distribution, and by convention adds 1.5 to allow for long-term drift. See the Sigma Level, DPMO, and Rolled Throughput Yield Guide. The number is a convenient summary, not a target by itself.
Worked Example: Twelve Weeks of Invoice Errors
A team checks 1,200 invoices each week and counts those with an error. The counts for 12 weeks are 72, 68, 75, 70, 66, 81, 74, 70, 110, 72, 69, and 73. The numbers are illustrative.
| Quantity | Calculation | Result |
|---|---|---|
| Total errors | sum of the 12 counts | 900 |
| Total items checked | 12 × 1,200 | 14,400 |
| Center line p̄ | 900 / 14,400 | 6.25% |
| Standard error | √(0.0625 × 0.9375 / 1,200) | 0.699 percentage points |
| Upper control limit | 6.25% + 3 × 0.699% | 8.35% (about 100 errors) |
| Lower control limit | 6.25% − 3 × 0.699% | 4.15% (about 50 errors) |
| Approximate sigma level | Inverse normal of (1 − 0.0625) plus 1.5 | about 3.03 |
What the team does. Weeks 1 to 8 and 10 to 12 are within the limits, so the team does not chase individual ups and downs. Week 9 is outside, so it investigates: what changed? It finds that a new supplier's invoices arrived that week in a format the capture software read badly, producing coding and amount errors. It fixes the capture template, and the error rate returns to the usual range in week 10.
Just as important is what the chart says about the rest. The process is stable but running at about 6.25%, so reducing it below that needs a change to the process itself, such as the coding and PO improvements in the Invoice and Payment Accuracy Guide. After such a change, the team watches for a sustained shift below the center line, then recalculates the limits from the new data.
Enter your own counts in the Transaction Quality p-Chart Calculator.
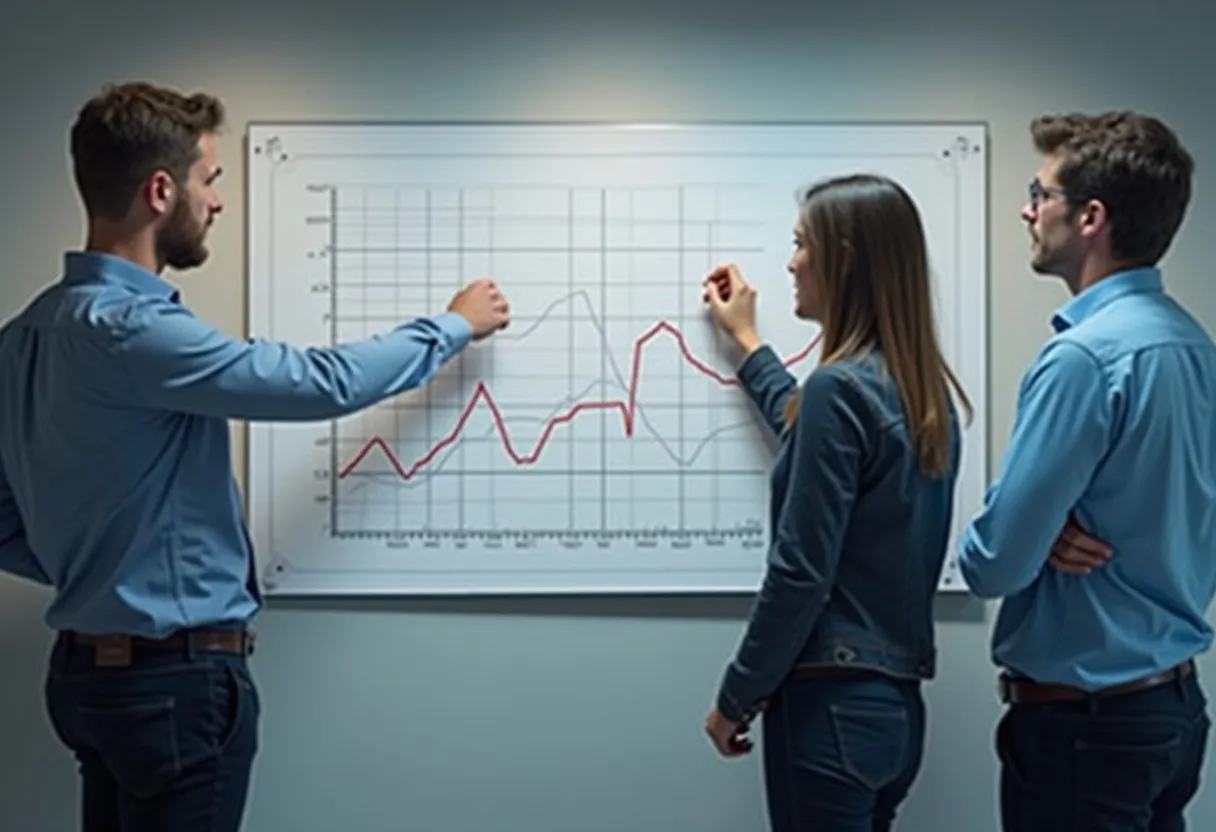
Choosing the Right Attribute Chart
Transaction data are counts, not measurements, and there is a family of attribute control charts. The choice depends on two questions: are you counting items that have at least one error, or the total number of errors, and is the sample size constant?
Examples. Invoices with at least one error out of a varying number checked each week: p chart. The number of coding errors per batch where every batch has 500 lines: c chart. Errors per 1,000 lines in batches of varying size: u chart.
Sample size matters. Charts of rare events need large samples. A common rule of thumb is that the expected count of errors per period should be at least five, otherwise the limits are unstable and most points will sit at zero. If counts are small, combine periods or use a chart for rare events.
Use the same definition of an error. Changing what counts as an error makes the chart jump without the process changing. Write the definition and train the people who check.
Reading Signals and Improving the Process
A chart is useful only if people respond appropriately to what it shows. The responses differ depending on the kind of pattern.
| Pattern | Likely meaning | Response |
|---|---|---|
| A point beyond a control limit | A special cause in that period | Find what changed and correct it; record the finding |
| Eight or so points in a row on one side of the center line | A sustained shift | Look for a lasting change in method, supplier, or system |
| A steady trend up or down | A drift, such as tool wear or workload creep | Find the source of the drift |
| Points within limits, no pattern | Common-cause variation only | If the rate is too high, improve the process itself |
| Points clustered very close to the center line | Possibly wrong limits or data smoothing | Check the data and the calculation |
Drill down. When a signal appears, split the errors by type, source, team, or shift with a Pareto chart to find the main contributors. Stratified data often show that the cause is concentrated.
Improve the process, then re-baseline. After a lasting improvement, calculate new limits from data after the change. Do not keep old limits on a changed process.
Use the chart in a regular meeting. Review it weekly with the people who do the work. A chart that lives in a report but not in a conversation will not change behavior.
Pitfalls. Recalculating limits every period; treating limits as targets; mixing data from different processes on one chart; and reacting to every point. See the Transaction Quality p-Chart Calculator, the Control Chart Selector, and the SPC Control Charts Guide. This guide is educational and is not accounting, audit, tax, or legal advice. Follow your accounting policies, the standards that apply to you, and the advice of qualified professionals. Figures in the examples are illustrative.
Self-Assessment Questions
- Do we chart error rates over time, not just report the latest number?
- Do we know our limits, and do we investigate only points outside them?
- Do we find the cause of each special-cause point?
- Do we change the process to move the center line, not just react to signals?
- Do we recalculate limits after a lasting improvement?
Common Mistakes
Reacting to Every Move
Points inside the limits are normal variation. Acting on each one is tampering and adds variation.
Using the Wrong Limits
If sample sizes vary, use limits for each point. Do not reuse one set.
Recalculating Limits Constantly
Limits should reflect a stable process. Recalculate after a real, sustained change.
Ignoring Signals
A point beyond the limit usually has a cause worth finding. Investigate it promptly.
Transaction Quality and p-Charts: Frequently Asked Questions
What is a p-chart?
A p-chart is a control chart for the proportion of nonconforming units, such as the share of invoices with an error, in each sample or period. It plots the proportion over time against a center line, the average proportion, and control limits at three standard errors either side, so normal variation can be told apart from special causes.
How do you calculate p-chart control limits?
The center line is the total number of nonconforming units divided by the total number inspected. The limits are the center line plus and minus three times the square root of p-bar times one minus p-bar, divided by the sample size for that point. Limits vary by point if sample sizes differ.
What should we do when a point is outside the limits?
Investigate for a specific cause, such as a change in system, supplier, procedure, or staffing in that period. If a cause is found, correct it. Do not react to points inside the limits, which are normal variation, and if the process is stable but the rate is too high, change the process itself.
Sources and Further Reading
- Douglas C. Montgomery, Introduction to Statistical Quality Control, chapter on control charts for attributes.
- NIST/SEMATECH e-Handbook of Statistical Methods, p-chart section.
- Donald J. Wheeler, Understanding Variation.
- ASQ Certified Six Sigma Black Belt Body of Knowledge, control charts.